
When you think about commodities trading, what first comes to your mind? It’s most likely crude oil.
However, natural gas, which many consider the twin of crude oil, is also an important asset for traders and investors seeking exposure to commodities.
The price of natural gas is volatile (more volatile than crude oil), and this creates opportunities to profit from short-term fluctuations. It responds to geopolitical events, economic news, inventory reports, supply disruptions, and even weather changes. The seasonality in its demand also creates profit-making avenues for those who know how to explore it.
Also, the natural gas market is known for its huge liquidity (it is the second most liquid commodity market after crude oil), making it ideal for traders.
However, due to its higher price volatility and lower price predictability, you need to master the top natural gas trading strategies to have a chance of being a successful trader.
In what follows, we will highlight the 5 best natural gas trading strategies that you can explore to profit from the natural gas market. We also provide a downloadable PDF checklist that you can use to profitably execute these strategies.
Do you want to learn more about the macroeconomic and geopolitical factors that drive the oil and gas markets? Sign up now for Sarwa’s Fully Invested newsletter for regular updates about the global economy.
1. Trading seasonality
Weather is one of the top factors that drives natural gas price fluctuation. During the winter (colder months: December to February), heating demand increases, which leads to higher gas consumption.
Similarly, during the summer (drier months: June to August), the demand for natural gas increases due to higher electricity usage.
On the other hand, demand for heating and cooling reduces in spring (March to May) and autumn (September to November) as the temperature is milder during these periods, leading to lower trading activities.
As the time series data charted below shows, demand for natural gas strengthens as we approach summer and winter.
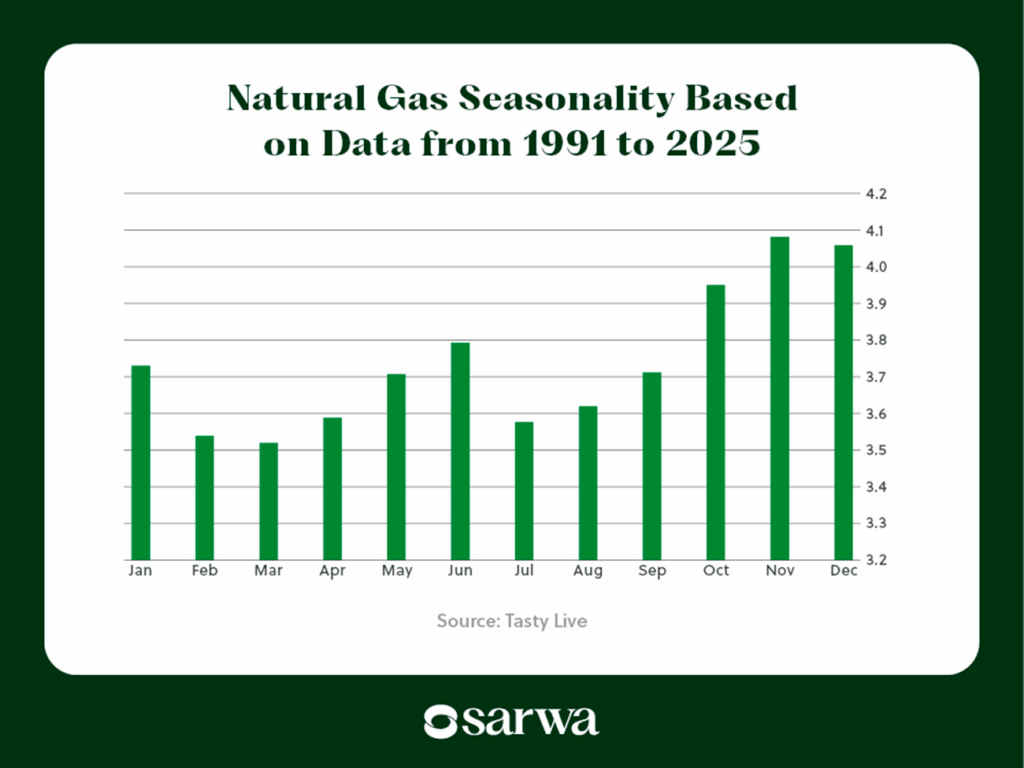
Source: Tasty Live
As a trader, you can maximize your profits by going long when the market bottoms out at the end of spring and autumn to ride the wave that comes in winter and summer. Or you can short the market at the peak of summer and winter and close your trades at the bottom of spring and autumn.
Actionable Natural Gas Trading Strategies Checklist for Trading Seasonality
Review historical natural gas demand trends
Identify peak and trough months: typically winter (Dec–Feb) and summer (Jun–Aug).
Plan long positions at the end of spring/autumn (when market prices bottom).
Plan short positions at the peak of summer/winter (when market prices top).
Use weather forecasts and seasonal demand reports to confirm timing.
Monitor EIA inventory data for supply-demand confirmation.
Set clear entry and exit targets based on historical seasonality ranges.
Always apply stop-loss orders to protect from unseasonal volatility.
2. Trading the news
In addition to weather conditions, economic, inventory, and geopolitical news also drive natural gas prices.
Supply chain disruptions, conflicts in gas-producing countries and regions, and changes in government energy policies (emissions reduction targets and shift to renewable energy, for example) can all cause fluctuation in the price level of natural gas.
How can you trade these news events?
Like with all commodity markets, the first thing is to identify whether the news will affect demand or supply. For example, supply chain disruptions and geopolitical tensions will affect supply, while a change in energy policies will most likely affect demand.
Secondly, you want to figure out how the news will affect commodity prices. Will it cause the price of natural gas to rise or fall?
The former will happen if the news event leads to lower supply or higher demand. On the other hand, the latter will subsist if the news event leads to a higher supply or lower demand.
For example, if a pandemic causes supply chain disruptions, prices will rise. But if a shift to renewable energy causes demand for natural gas to fall, prices will fall.
You can trade the news in three ways.
First, you can anticipate the news by taking a trade that aligns with your expectations. For example, if current happenings suggest a conflict in a gas-producing region is imminent, you can prepare for such by going long on natural gas.
Second, if you have a lower risk tolerance, you can wait for the news event to happen and then quickly ride the wave. To continue with the previous example, you may want to wait for the conflict to start and its effect on the natural gas market to build up a bit before going long. Also, you will need to monitor the conflict so you can exit the trade when the effect of the news peaks.
Third, you can fade the news. This is a strategy where you position yourself to benefit from the market’s overreaction to a news event.
Consider the example where a small change in US energy policy leads to a 10% drop in natural gas prices. If you believe that this is an overreaction that will correct itself, you can go against the grain by going long at the point where you think overreaction has set in. If a 5% drop is reasonable, you can go long at that point.
However, since the market can be irrational for a long time, fading the news will always be a high-risk venture.
Actionable Natural Gas Trading Strategies Checklist for Trading the News
Track key news sources (EIA, OPEC, Reuters, Bloomberg Energy).
Identify whether the event affects supply or demand.
Assess whether it’s likely to cause a price rise (bullish) or a price fall (bearish).
Choose a trading approach:
Anticipate the news: Enter before the event based on probable impact.
React to the news: Wait for confirmation, then follow the direction.
Fade the news: Trade against overreactions (advanced traders only).
Confirm moves using technical indicators (volume spikes, momentum).
Place trades with a defined risk-reward ratio (e.g., 3:1).
Use tight stop losses when trading during high-volatility news periods.
Track ongoing developments to adjust or close positions.
3. Spread or mean-reversion trading
If you are familiar with the gold and silver markets, you probably know about the gold-silver ratio. This is a measure of the price ratio between gold and silver at any given point.
When this ratio diverges from its historical average, traders profit by longing the undervalued asset and shorting the overvalued one, in expectation of a reversion to the mean relationship between them.
The same strategy can be used for natural gas trading. And this leads us to one of the popular natural gas trading strategies: spread or mean-reversion trading.
To execute this strategy, you will need to monitor the average relationship between natural gas and crude oil, identify divergence, and then trade in expectation of a mean reversion.
This average relationship can be examined using the crude oil-natural gas ratio (similar to the gold-silver ratio). Below is how the chart has looked over the past five years:
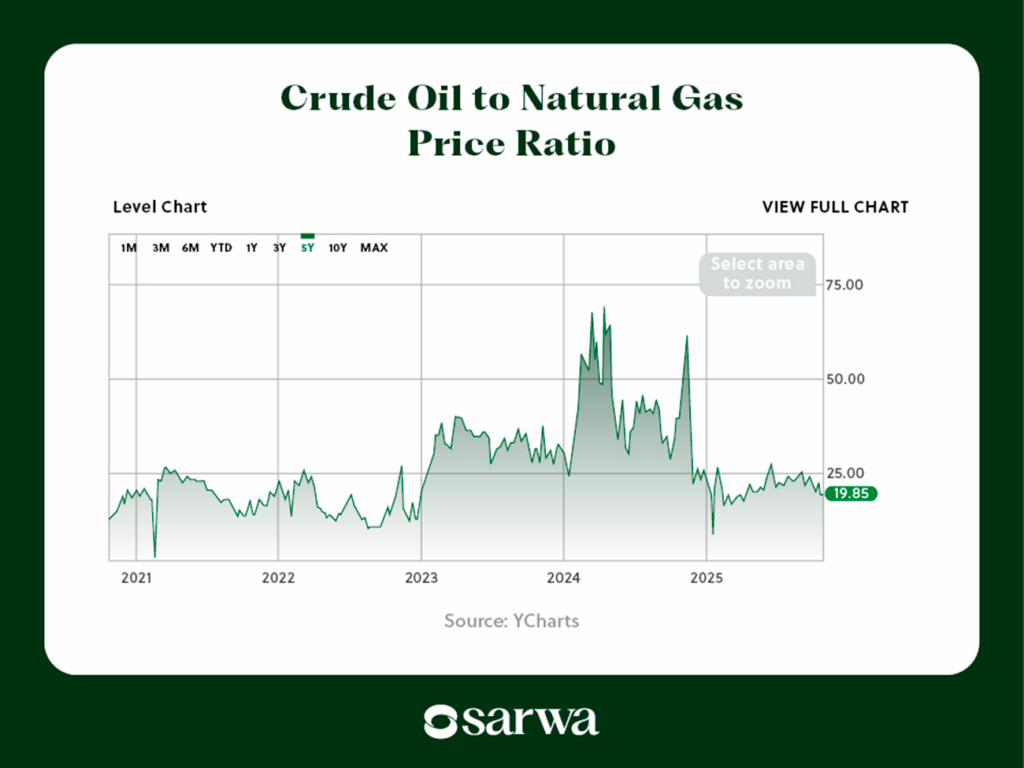
Source: YCharts
From this chart, a trader can notice the wide divergence that occurred in early 2024 and decide that crude oil was overvalued. In response, they can short crude oil and go long on natural gas.
Related to spread trading is arbitrage trading, a system where you profit from price differentials across various markets.
For natural gas, the prices of futures trades can differ across exchanges like the New York Mercantile Exchange (NYMEX), the International Continental Exchange (ICE), and the Multicommodity Exchange.
Similarly, since there are more than half a dozen natural gas price benchmarks, there is a higher probability of discovering price arbitrages across benchmarks. If you are a swing or intraday trader, you can take advantage of these opportunities.
Also, some market participants trade the divergence between the futures and spot markets using cash-and-carry arbitrage in contango (when the futures price is greater than the spot price) and reverse cash-and-carry arbitrage in backwardation (when the spot price is higher than the futures price).
Given the technological developments in the financial markets, many traders now use sophisticated algorithms and automation tools to quickly identify and take advantage of such arbitrage opportunities.
Actionable Natural Gas Trading Strategies Checklist for Mean-Reversion Trading: Method 1
Monitor the crude oil–natural gas ratio (historical average benchmark).
Identify divergence from historical mean; the larger the gap, the greater the opportunity.
Use statistical analysis or correlation tools to confirm mean reversion potential.
Go long on the undervalued asset and short the overvalued one.
Exit once the ratio returns near its mean value.
Manage risk by hedging or limiting leverage on both sides of the spread.
Actionable Natural Gas Trading Strategies Checklist for Mean-Reversion Trading: Method 2 (Arbitrage Trading)
Watch for arbitrage opportunities between exchanges (NYMEX, ICE, MCX, etc.).
Track regional benchmarks (e.g., Henry Hub, NBP, TTF) for price disparities.
Buy in the cheaper market and sell in the expensive market
4. Range trading
Though the natural gas market is very volatile, there are times when the market moves in a range. That is, it moves between a price floor (support) and a price ceiling (resistance), where there is no clear trend.
Below is an example from 2023:
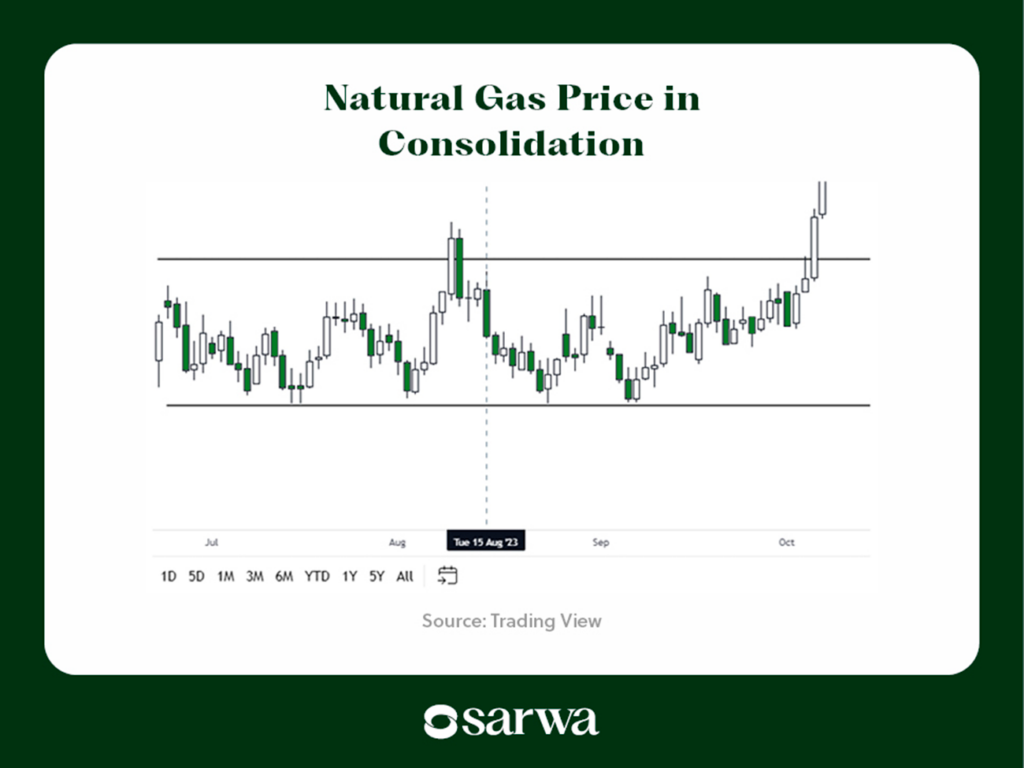
Source: Trading View
Between July and October 2023, prices kept moving between $2.438 and $2.901 per MMBtu as bulls and bears continued to struggle with each other. This continued until there was a breakout in October when the bulls won.
You can trade such markets by buying close to the support and selling close to the resistance, or shorting at the resistance and closing the trade at support.
Consolidation markets provide opportunities to make many profitable deals over a given period. However, due to the volatility of the natural gas market, such opportunities are rare.
Actionable Natural Gas Trading Strategies Checklist for Range Trading
Identify a sideways/consolidating market (no clear uptrend or downtrend).
Use charts to mark support (floor) and resistance (ceiling) zones.
Go long near support levels and short near resistance levels.
Confirm range boundaries using RSI (overbought/oversold zones).
Watch for a volume drop within the range to confirm consolidation.
Place stop losses just outside the range to limit breakout risk.
Take profits before reaching opposite boundaries to reduce reversal exposure.
Be alert for breakouts (when volume surges and price closes outside the range).
5. Trend following
Trend following is one of the most popular natural gas trading strategies. It involves going where the market is going instead of trading against it.
In other words, you go long when the market is in an uptrend and you go short when the market is in a downtrend.
This approach depends on understanding the direction the market is currently going. The market is in an uptrend when the price chart is showing higher highs and higher lows, and it is in a downtrend when it is showing lower highs and lower lows.
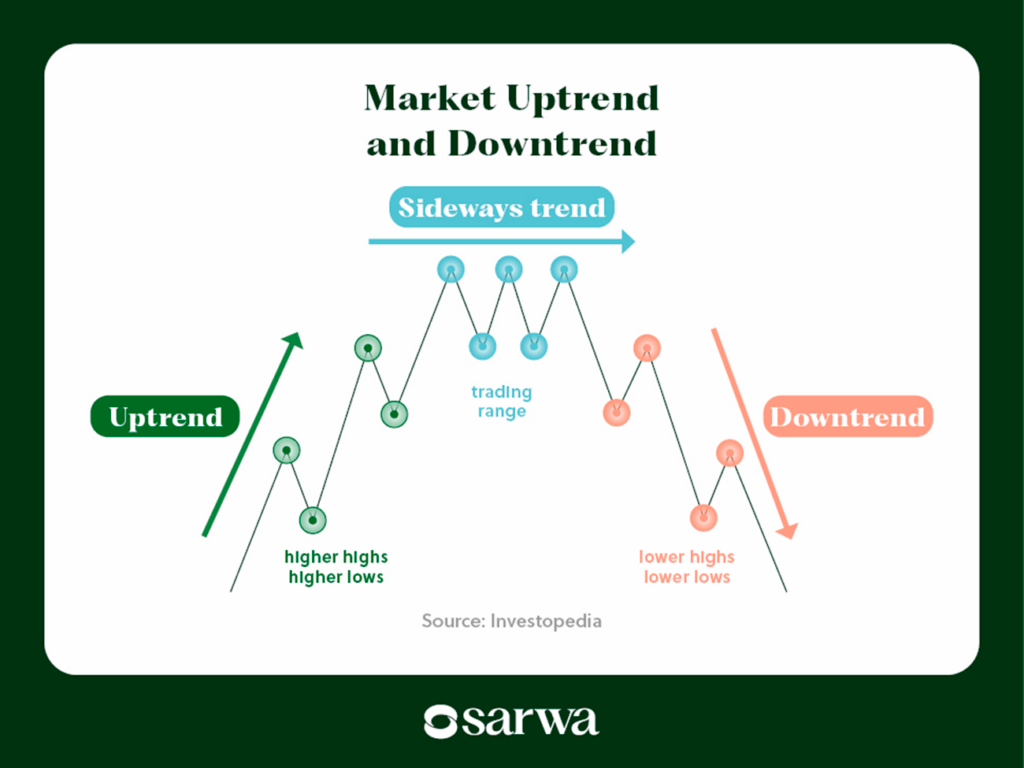
Source: Investopedia
Once you have identified the market’s trend, the next step is to decide when to enter and exit the trade. This is where the importance of technical analysis shines through.
Some of the popular entry rules traders use across financial markets include:
- Trendlines: Trendlines are support and resistance lines in trending (rather than consolidating) markets. Below is an example:
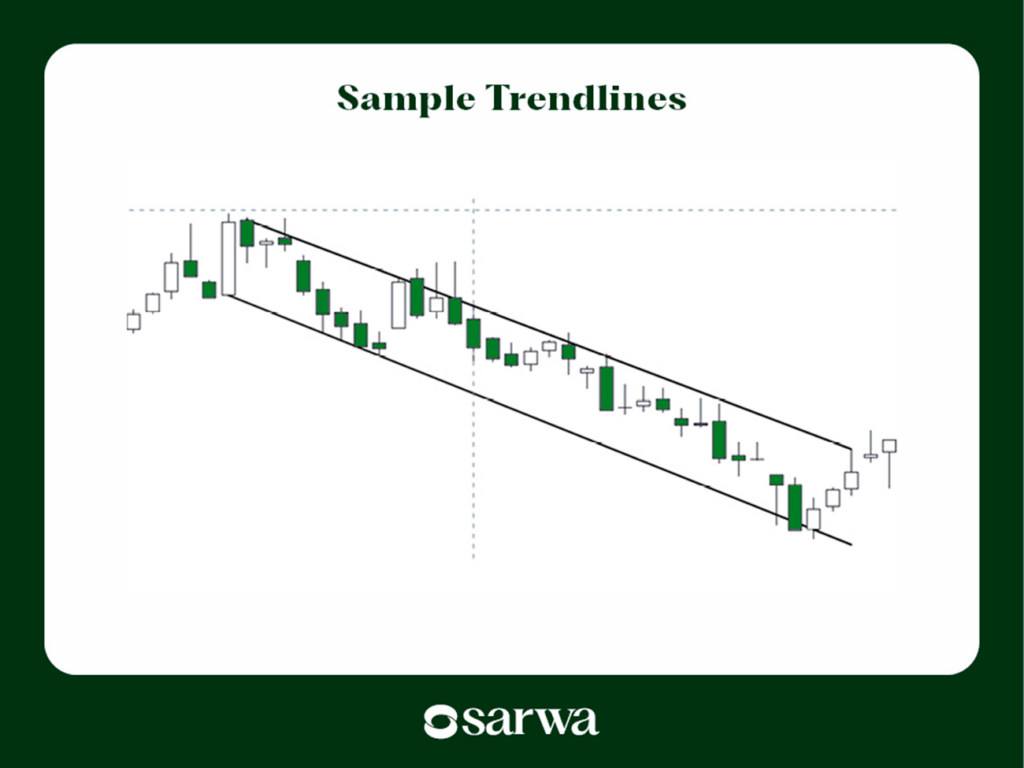
In the chart above, the market is in a downward trend. The line below is the support line, and the one above is the resistance line. You can enter a short when the price hits the resistance line and then close it when the price hits support.
- Moving average crossover: A moving average (MA) shows the average price movement of an asset over a given period (the 50-day MA and the 200 MA are the most popular). When a short-term MA crosses a long-term MA from below, the price will likely go up, and vice versa. That point where the crossover occurs can be an entry point.
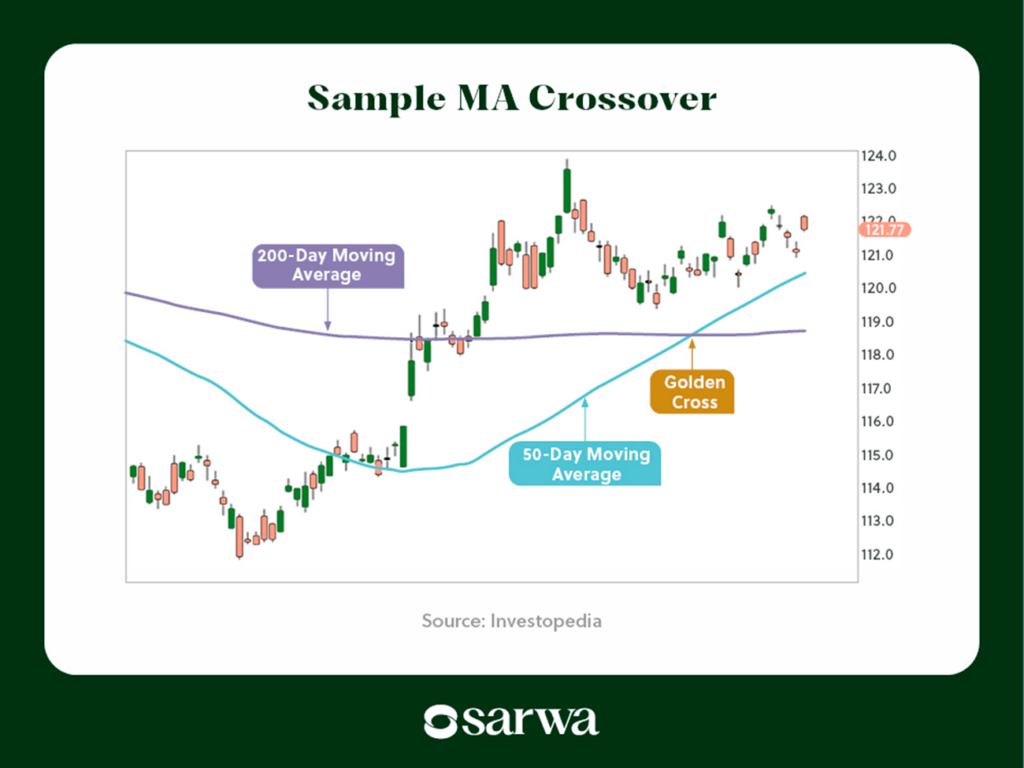
Source: Investopedia
- MACD crossover: The MACD is one of the top 6 technical indicators used in technical analysis. When the MACD line crosses the signal line from below, an uptrend is likely, and vice versa.
Sample MACD Crossover
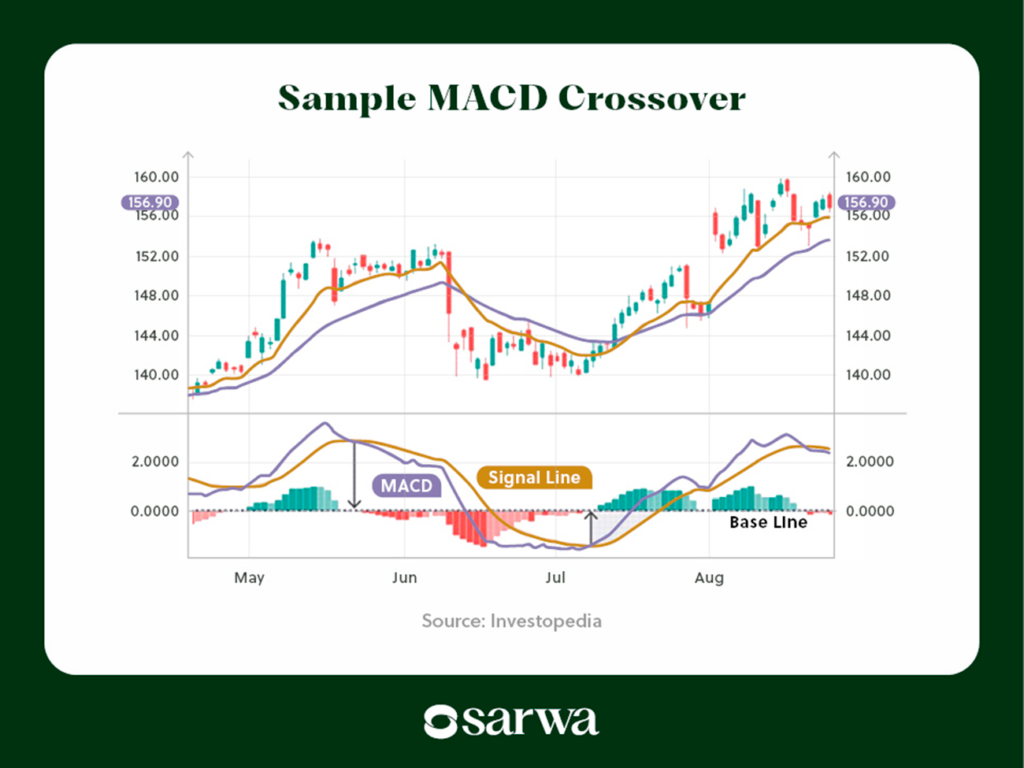
Source: Investopedia
- Candlestick patterns: Candlestick patterns can also serve as entry points. Some patterns show that a trend will continue, while others show that a trend reversal is imminent. Below are some of the most popular candlestick patterns.
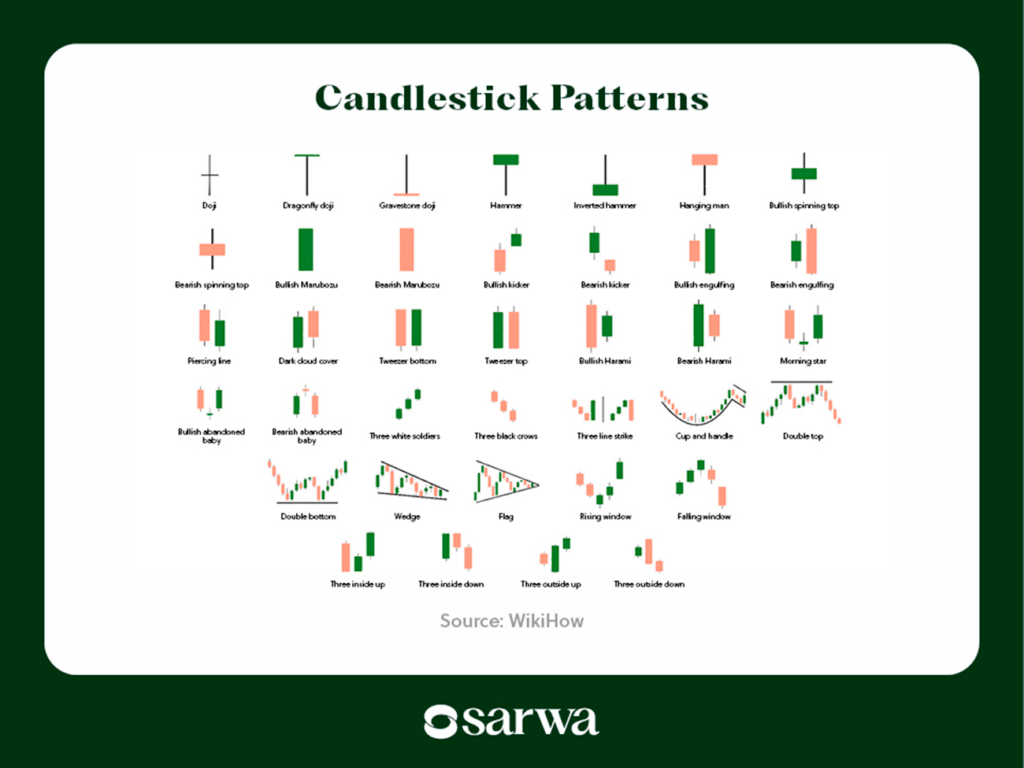
Source: WikiHow
- Chart patterns: Chart patterns are price action patterns noticeable on price charts. They also reveal when a trend is poised to continue or reverse, and can thus serve as entry points.
Some of the common chart patterns include:
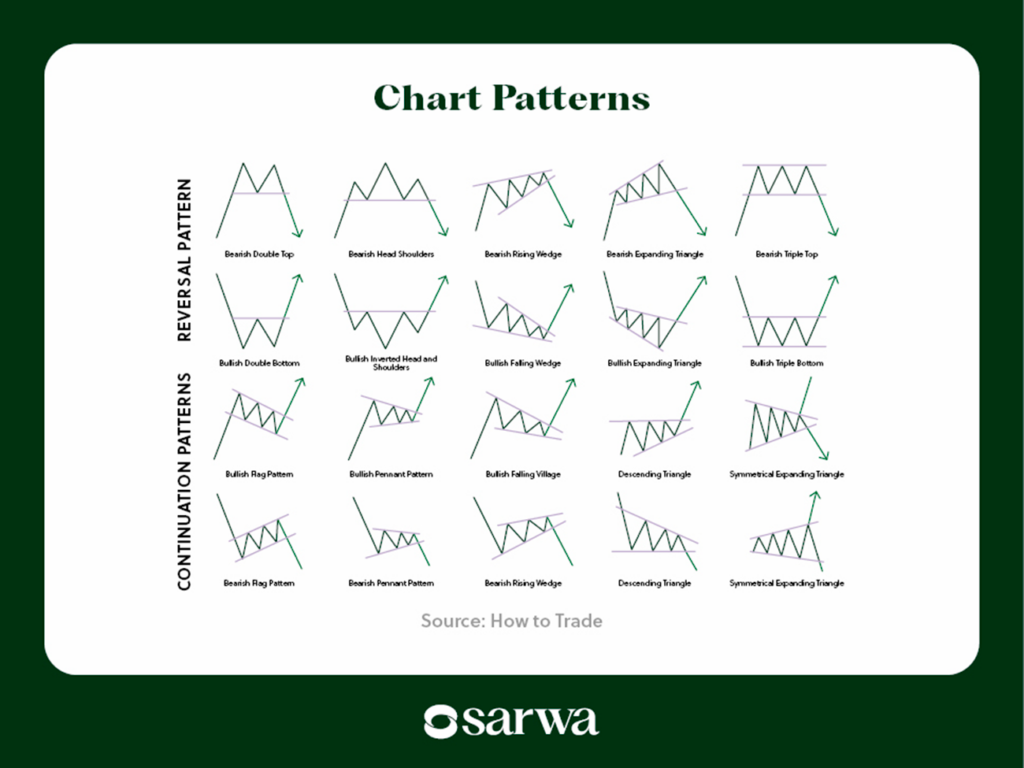
Source: How to Trade
With the trend following strategy, you can exit a trade when the trend ends and a reversal becomes imminent. Most traders will exit a profitable trade once they have achieved a certain reward-to-risk ratio (usually 3:1), irrespective of whether they believe the trend is ending or not.
For an unprofitable trade, you should set a stop loss, which is the point at which you cut your losses short. You can set this up using technical indicators like the average true range (ATR) and the parabolic SAR, or manually based on your trading capital and the amount you are willing to risk on a single trade.
Actionable Natural Gas Trading Strategies Checklist for Trend-Following Trading:
Identify the trend:
Uptrend: Higher highs & higher lows.
Downtrend: Lower highs & lower lows.
Use trendlines, moving averages (50 MA / 200 MA), or MACD to confirm direction.
Look for entry signals:
MA crossovers (golden/death cross).
MACD line crossing the signal line.
Bullish/bearish candlestick or chart patterns.
Set stop-loss below (for longs) or above (for shorts) recent swing points.
Use sound risk management: Define take-profit levels or use trailing stops to lock in gains.
Avoid countertrend trades. Instead, wait for clear reversals before switching bias.
Review trend strength regularly using indicators like ADX.
Stay disciplined: follow the trend until it clearly ends.
How to trade natural gas in the UAE
Now that you know the top natural gas trading strategies to explore, let’s consider how to get started trading natural gas in the UAE.
If you want direct exposure to natural gas prices, you can trade derivatives like contracts for difference (CFDs), futures contracts (which are often the most liquid instruments in energy markets), swaps, and options contracts (more useful for hedging strategies against price risk). On the other hand, you can trade oil and natural gas stocks, ETFs, and ETNs if an indirect exposure is your preference.
At Sarwa, we provide you with access to energy commodities stocks like Oil-Dri Corporation of America (ODC) and Oil States International Corporation (OIS).
We also provide access to oil and gas exchange-traded notes like the MicroSectors Oil and Gas Exploration and Production 3X Leveraged ETN (OILU) and the MicroSectors Oil and Gas Exploration and Production -3X Leveraged ETN (OILD).
You can also trade in the natural gas futures market through the United States Natural Gas Fund LP (UNG). This is an ETF that tracks natural gas futures contracts that are traded on the NYMEX. Instead of trading a single futures contract, you can trade a basket of near-month contracts, providing you with more diversification and less risk.
Trading natural gas on Sarwa is convenient and cost-effective.
Sarwa provides a user-friendly interface, an all-in-one platform, and educational resources that will improve your trading decisions and make your trading journey seamless.
With just $500, you can create a trading account and start trading natural gas, among other financial instruments. We charge a low commission of $1 or 0.25% of traded value, and there are no hidden fees.
We also secure our platform with bank-level SSL security, so you can be sure your data and money are safe.
Are you ready to trade natural gas in the UAE? Sign up for Sarwa for cost-effective and seamless trading in the UAE.
Takeaways
- Natural gas has both high price volatility and trading volume, two features that make an asset appropriate for trading.
- The five top natural gas trading strategies include: seasonality trading, trading the news, mean reversion, range trading, and trend following.
- Like other assets, knowing when to enter and exit a trade is the key to succeeding with natural gas trading.
- You can trade natural gas in the UAE through oil and gas stocks, futures contracts, ETNs, and ETFs, among others.