
If someone asks if you want to be rich or happy, you will probably say you want both. This shows that some things that are contrasted can actually be combined. The same logic applies to stock market fundamental and technical analysis.
For some people, you are either a long-time investor who focuses on fundamental analysis like Warren Buffett or a trader who concentrates on technical analysis like Robert Rhea, author of The Dow Theory.
The stock market fundamental and technical analysis discussion has often been couched in this either-or format for many years. However, many now recognisze that this can be a false dilemma and it’s possible to combine both as an investor or a trader.
“Using a combination of both could be the ultimate winning strategy,” according to The Ticker, an American newspaper.
In this article, we will consider stock market fundamental and technical analysis, how they differ, and how they can be combined to help traders and investors. We’ll cover:
- What is fundamental analysis?
- What is technical analysis?
- Fundamental analysis vs technical analysis: How they differ
- Stock market fundamental and technical analysis: How they can be combined
[Do you want to become better at stock market fundamental and technical analysis? Subscribe today to Sarwa’s Fully Invested newsletter for regular updates that will improve your investing and trading skills.]
1. What is fundamental analysis?
The best way to understand fundamental analysis is to reflect on one of Warren Buffett’s quotes: “It’s far better to buy a wonderful company at a fair price than a fair company at a wonderful price.”

Fundamental analysis is the art of identifying wonderful companies to invest in. Since a stock is a portion of ownership in a company, the long-term price of a stock will reflect the performance of the company whose ownership it represents.
From Warren Buffett’s stock holdings and statements made in various contexts, we can identify two key aspects of fundamental analysis: quantitative analysis and qualitative analysis.
The former involves combing through a company’s financial statements (balance sheet, cash flow statement, and income statement) to see how well it performs while the latter entails non-financial indicators of a company’s performance like its management and products (or services).
Quantitative analysis
Three types of financial ratios are used to summarisze a company’s financial health:
- Profitability ratios: These ratios highlight how well a company can generate profit from its operations. Profitability can be measured against the assets of the company /return on assets), its equity (return on equity), or its employed capital (return on capital employed).
- Liquidity ratios: These ratios consider how well a company can meet its short-term obligations (current liabilities) from its short-term assets (current assets).
- Leverage or solvency ratios: These ratios focus on how viable a company is in the long term. It does this by comparing its debt level with its assets and equity. If a company has too much debt relative to assets and equity, then its long-term viability is doubtful.
Warren Buffett considers these three ratios when conducting the quantitative analysis of a company.
His most popular metrics across the three categories are:
- Return on equity (ROE): As an investor, you want to know how well the company is using shareholders’ funds (equity). Return on equity is a good measure of this. It shows how much profit the company is making from the equity it holds. The formula is net profit divided by equity multiplied by 100.
A high (relative to competitors) and growing ROE is one of the marks of a wonderful company.
- Net profit margin: This is another profitability ratio. It is the net profit divided by revenue (multiplied by 100) and it measures how well a company can turn sales into profits. If this margin is low, it shows that too much of the company’s revenue is going to operational (selling, general, and administrative expenses) and non-operational (interest payment, tax) expenses.
A high and growing profit margin shows that a company is excellent at managing its expenses and turning revenue into profit.
- Current ratio: This is a liquidity ratio that shows how many times a company’s current assets (convertible to cash within a year) can cover its current liabilities (obligations that are due within a year).
It is calculated as current assets divided by current liabilities.
Buffett prefers a current ratio of at least 1.5.
- Debt-to-equity ratio: This is calculated as total debt divided by total equity and it indicates how leveraged (dependent on debt) a company is. A company with a high debt-to-equity ratio is using more debt than equity to finance its assets.
Buffett prefers companies with more equity than debt (given the impact of debt on long-term viability) and thus wants a debt-to-equity ratio below 0.5 or 50%.
- Economic moat: Buffett prefers companies that have durable and sustainable competitive advantages. That is, they have things they are especially good at that others cannot profitably replicate.
Though a huge part of the economic moat can be uncovered using qualitative analysis, there are some quantitative indicators as well. These include sustained high return on invested capital, sustained high gross margins, and high market share, according to Indexology Blog, a blog of S&P Global, a global financial corporation.
Quantitative Indicators of Economic Moat
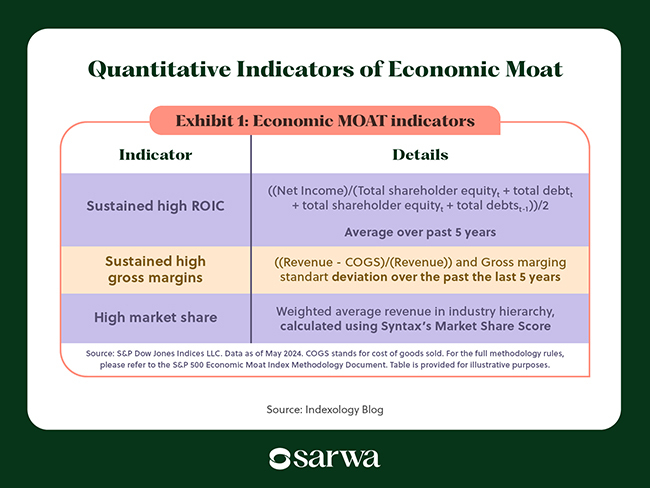
Source: Indexology Blog
Qualitative analysis
Many indicators of good performance cannot be quantified. “An investment operation is one that can be justified on both qualitative and quantitative grounds,” according to Benjamin Graham, Buffett’s teacher and mentor.
Adding qualitative analysis can help you produce a sound investment strategy.
Some useful qualitative indicators include:
- Management: Buffett is big on the quality of a company’s management. Here, he is concerned about their passion for and understanding of the business, how well they manage the company, and how they treat shareholders.
He wants managers who serve the interest of shareholders (especially in capital allocation decisions) rather than seeking to exalt themselves.
- Economic moat: Some qualitative indicators of economic moat include having products or services that are unique. For him, this uniqueness will be reflected in the company’s capacity to increase prices without losing market share.
“If you’ve got the power to raise prices without losing business to a competitor, you’ve got a very good business. If you have to have a prayer session before raising the price by 10%, then you’ve got a bad business,” he said.
- Economy-wide (macroeconomic) analysis: “Fundamental analysis frequently involves looking at gross domestic product, inflation, unemployment rates, industry or sector trends, and the company’s competition,” according to Investopedia, a financial education website.
Knowing the direction that the larger economy is going can help to understand which sectors or industries will shrink. This type of analysis can be done by looking at economic indicators or by studying how technology is changing.
When digital camera technology replaced film-based photography, Sony came to the forefront and Kodak died.
Investors who understood what was happening would have gone out of Kodak and invested in Sony instead.
Even when a technology trend will disrupt rather than kill off an industry, it is important to identify companies with the capacity to flow with the trend and those that will die off.
Such qualitative macroeconomic analysis is crucial for successful long-term investment.
Fundamental analysis and value investing
For Buffett and other value investors, fundamental analysis ends in determining the intrinsic value of a company.
The intrinsic value is what the company is worth. In the short term, the company’s market price will deviate from this value, but in the long term, there is a closer alignment.
Consequently, value investors want to buy wonderful companies when they are undervalued – their intrinsic value is higher than the market price – so they can make money when the market price is catching up with the higher intrinsic value.
However, intrinsic value is subjective and two smart fundamental analysts will arrive at different values. To reflect this subjectivity, Buffett only buys a wonderful company when its market price is substantially less than the intrinsic value he calculates. In his early days, he insisted on a 50% margin of safety but he has been more flexible about this.
There are many valuation methods for calculating intrinsic value but they all boil down to which items on the financial statement you use for the calculation.
Some of the popular options include dividend (an example is the dividend discount model), cash flow (a popular example is the discounted cash flow model), earnings (P/E ratio being an example), and book value (P/BV being an example), among others.
2. What is technical analysis?
Technical analysis uses past price and volume data to predict future price action. It does this by identifying patterns and trends in past price and volume movements.
In essence, technical analysis is based on the principle that price patterns repeat themselves (because they are based on market psychology). “Technical analysts believe past trading activity and a security’s price changes can be valuable indicators of the security’s future price movements,” according to Investopedia.
Thus, technical analysis can be used to make money from buying stocks whose prices are expected to increase or shorting (selling) stocks whose prices are expected to decrease.
The practice of technical analysis goes back to Dow Jones, the founder of the Wall Street Journal and the Dow Jones Industrial Average Index. Since the popularization of his Dow Theory, others like William Hamilton, Robert Rhea, Edson Gould, and John Magee have developed the field of technical analysis, according to Investopedia.
There are four main parts to technical analysis as it is being used today: chart patterns, moving averages, and technical indicators. Understanding these three is crucial for learning how to start trading stocks.
Chart patterns
Price trends can be summarized in the form of charts that show the ebb and flow of a stock and thus reflect market sentiment. Line charts and candlesticks are the most popular charts used by technical analysts.
When it comes to pattern identification, the latter is the most useful. As seen below, a candlestick contains four pieces of information: the opening price, closing price, highest price, and lowest price within a timeframe.
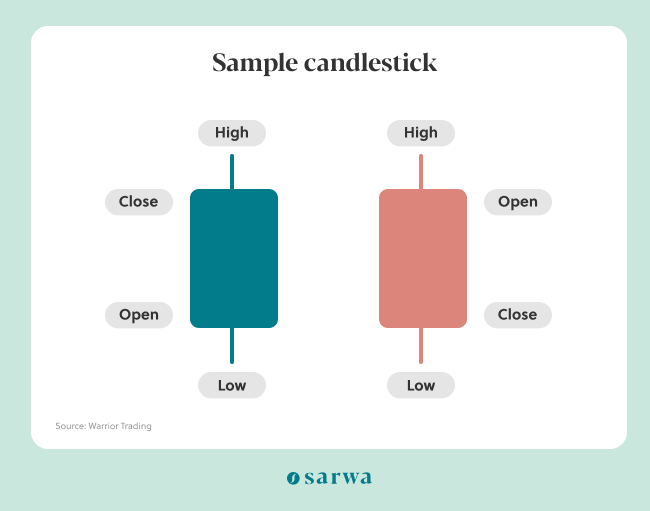
A candlestick chart shows various patterns. When a pattern has consistently resulted in price movement in a particular direction, technical analysts use it as a predictor of future price movement.
Some of the most popular candlestick patterns include bullish engulfing, bearish engulfing, morning star, evening star, hammer, and hanging hammer, among others.
Let’s use the first two to illustrate how chart patterns are used.
Below is the bullish engulfing chart pattern:
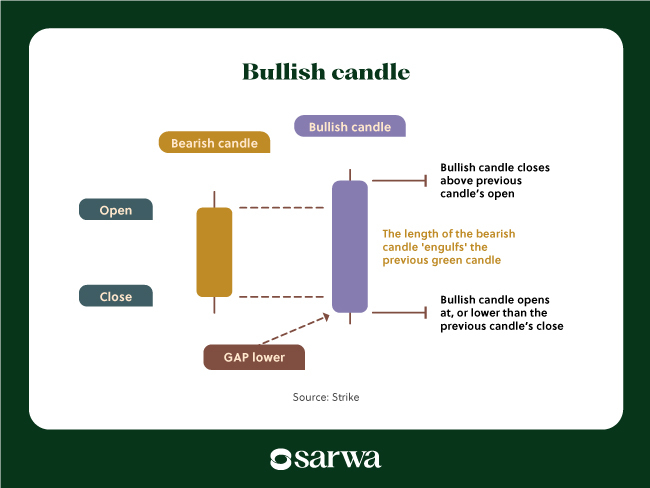
Source: Strike
When a green candle (bullish candle) engulfs a smaller red candle (bearish candle), some analysts see it as an indicator of an upward price movement, especially if it occurs at the end of a downward trend.
The bearish engulfing pattern, shown below, is the opposite of the bullish engulfing pattern.
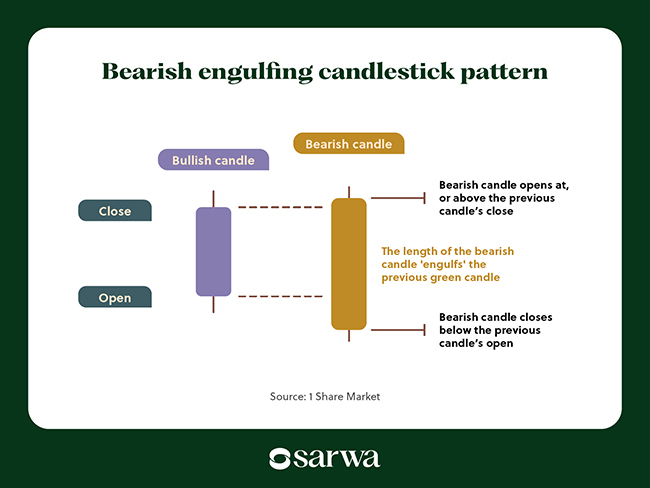
Source: 1 Share Market
When this pattern occurs at the end of an upward trend, it might indicate a reversal to a downward trend.
Support and resistance levels
Support and resistance levels are foundational to technical analysis.
When buyers keep buying at a particular price or price range and will not allow prices to fall below that range, that constitutes a support level. On the other hand, if sellers will not allow prices to rise above a range, that constitutes a resistance level.
Both can be seen in the chart below:
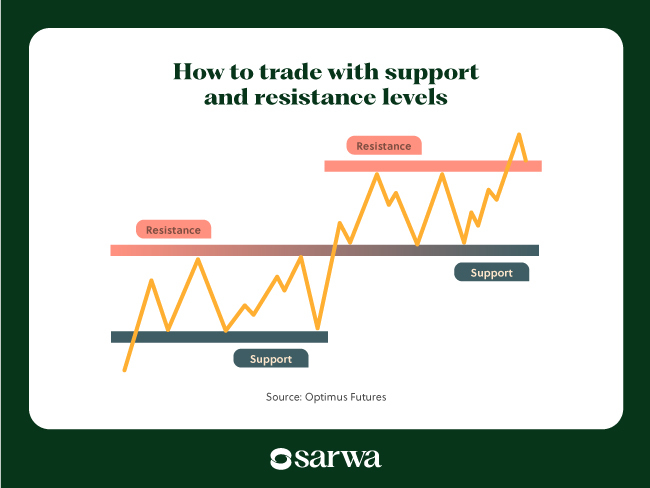
Source: Optimus Futures
If a support or resistance level has been tested many times, it can be expected to hold in the future. Some analysts will trade within this support and resistance range – buying at support and selling at resistance or shorting at resistance and taking profit at support.
Others will see trading opportunities only when a support or resistance level has been broken (breakouts), taking it as an indicator of a new trend. For example, a broken support indicates a downward trend, and a broken resistance an upward trend.
Moving averages
Moving averages are mean (average) price movements over a given period.
Below is an example of a moving average:
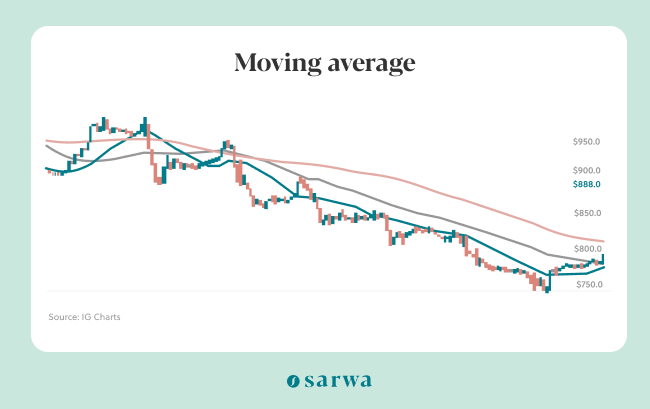
Moving averages can be simple or exponential. Simple moving averages (SMAs) accord equal weight to all historical prices within the given period while exponential moving averages (EMAs) allot greater weight to more recent prices.
Upward or downward moving average lines can indicate an upward or downward trend. Some analysts also use moving average crossovers as a trading strategy. For example, if a shorter moving average (say 50 SMA) crosses a longer one (say 200 SMA) from below, it can be seen as an indicator of an upward movement, and vice versa.
Technical indicators
Technical indicators are mathematical formulas that are added to a price chart to identify patterns and trends.
The top technical trading indicators include bollinger bands, relative strength index (RSI), moving average convergence and divergence (MACD), on-balance volume, momentum oscillator, and the average directional index (ADI).
There are three main uses of technical indicators:
- Identify market trends: An indicator can show if there is an uptrend or a downtrend.
Let’s illustrate using the MACD.
As seen below, there are three key components of MACD:
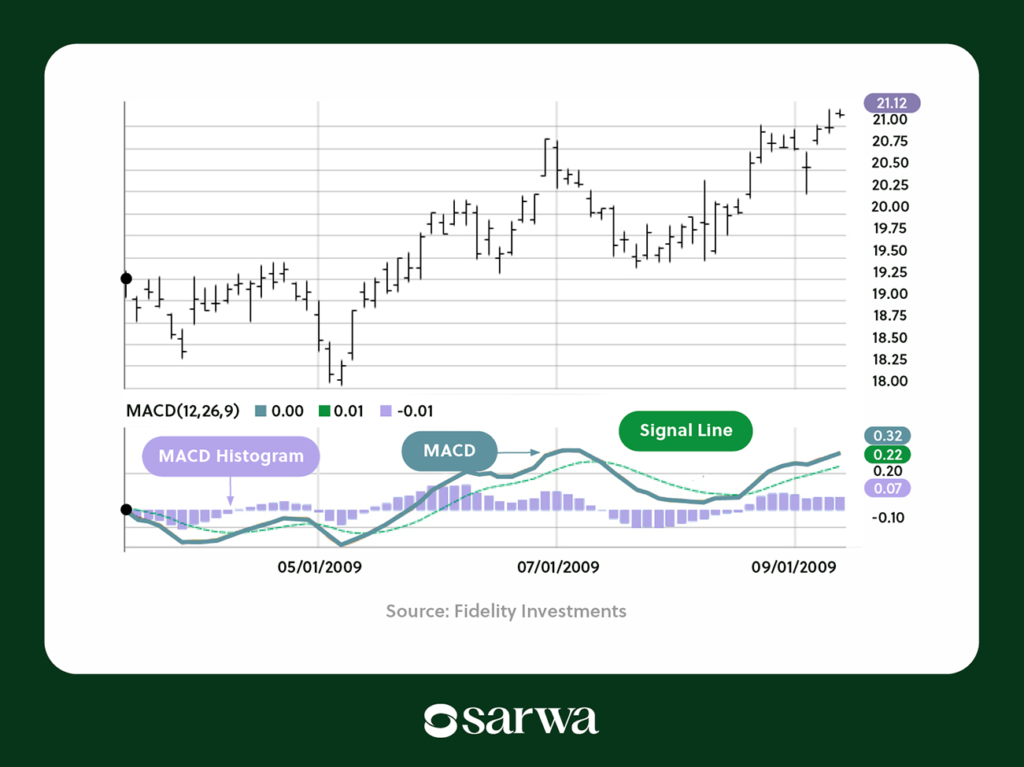
Source: Fidelity Investments
When the MACD line crosses the signal line from below, some take it as an indicator of an upward trend. In the same way, when it crosses from below, it is an indicator of a downtrend.
Some will use the MACD histogram as an indicator of trend direction. When the histogram is below 0, there is an uptrend and when it is below 0, there is a downtrend.
- Identify trend momentum: Upward and downward trends are not created equally. Some trends are stronger than others. Trading indicators can be used to show momentum.
ADI (shown below) is a point in case:
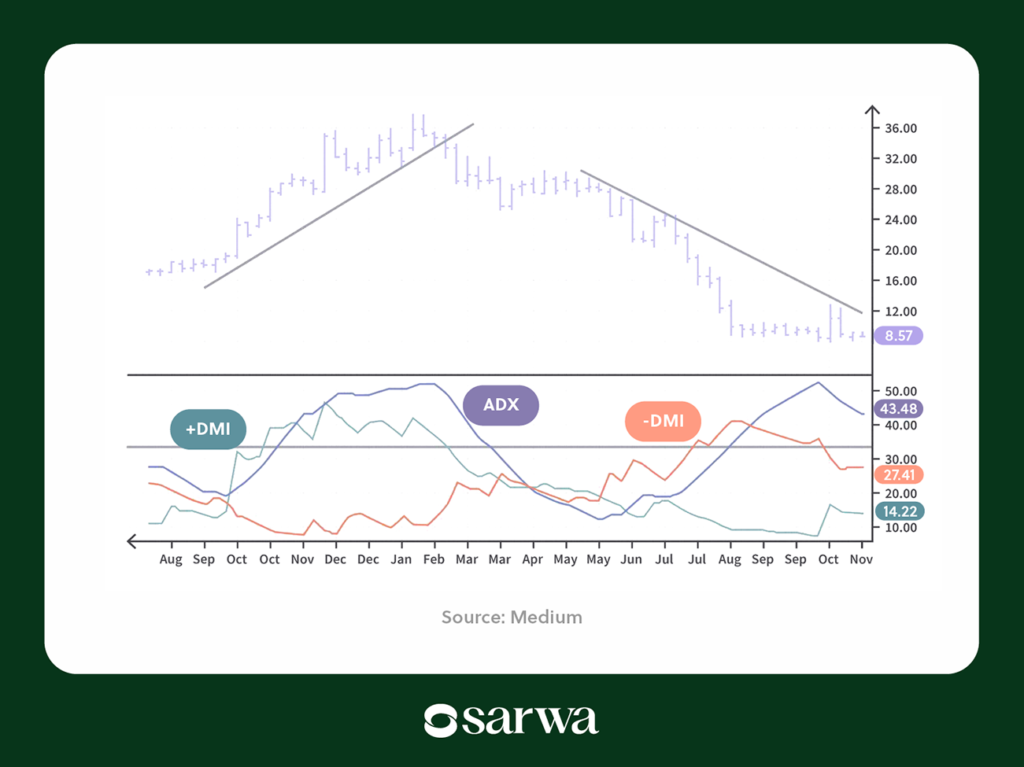
Source: Medium
Some analysts see the ADX line crossing above 25 (the dark horizontal line) as evidenceas an evidence of a strong upward momentum and below 20 as an indicator of a strong downward momentum.
- Identify reversals: When the price chart and an indicator diverge, this can be evidencebe an evidence of a price reversal.
Let’s illustrate with the RSI:
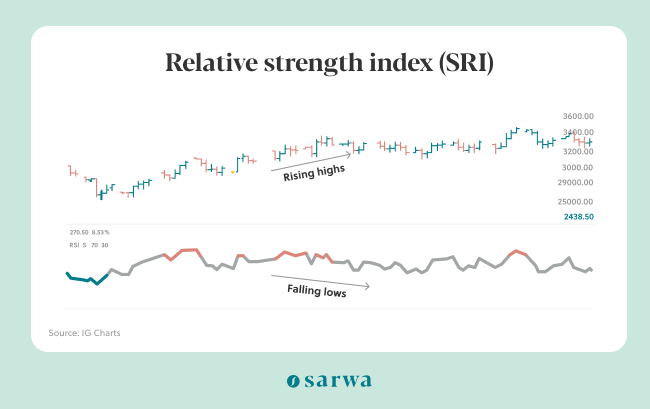
As seen in the chart, the RSI is having lower lows (downward trend) while the price chart has higher highs (upward trend). Some analysts use this as an evidence of a downward trend – the price chart aligning with the indicator.
Pro traders often use all four before making trading decisions.
3. Fundamental analysis vs technical analysis: How they differ
Stock market fundamental and technical analysis are different in many ways. Let’s highlight the most important ones:
Objective
As we have discussed, fundamental analysis focuses on selecting wonderful companies while the goal of technical analysis is predicting future price movements.
Users
Fundamental analysis is time-consuming and is more often used by long-term investors who want to build wealth from the stock market over the long haul.
On the other hand, technical analysis is often the purview of stock traders who want to make daily, weekly, or monthly profits from short-term movement in stock prices.
(Note: While both analyseis are used in other financial markets – forex, commodities, etc – our focus is on the stock markety.)
Data sources
Fundamental analysis prioritiszes the company’s financial statement in addition to other qualitative information about the company and the larger economy. On the other hand, technical analysis prioritiszes historical data.
Result
The result of fundamental analysis, especially for value investors, is the intrinsic value of a stock. This is then compared with the market price to determine if the stock is undervalued or overvalued.
On the other hand, the result of technical analysis is toa take profit and stop loss price targets.
These differences show that the fundamental vs technical analysis discussion must not attempt to collapse the two into one. They are not the same thing.
Nevertheless, as we will now go on to show, investors and traders can use both in their respective stock investment and stock trading strategies.
4. Stock market fundamental and technical analysis: How they can be combined
So, how does the both-and replace the either-or approach to stock market fundamental and technical analysis? Two ways: investors using technical analysis to improve investment decisions and traders using fundamental analysis to enhance their stock trading strategies.
Technical analysis for investors
The lower the price you purchase a stock, the higher the returns you make on that stock. If you purchase a stock for $10 and sell it for $100, you have made a 900% return. What if you had purchased it for $20? The return reduces to 800%.
Thus, though long-term investors don’t care about short-term price movements, the price they buy and end up selling for determines their return on investment (ROI). Every long-term investor would gladly accept a 900% return over an 800% return.
How is this relevant to our discussion?
Simply this: investors can use technical analysis to purchase a stock at the bottom so they can maximisze their ROI.
Price charts will show where the current price is and whether it is going up or down. If an investor is convinced, by technical analysis, that prices are coming down, they can change their entry point and hold up their purchase until prices have bottomed out (at a support level, for example).
Investors can do this every time they intend to increase their stake in the stock. Prices may not fall back to the initial purchase price but at every period, there is often a price range (at support and resistance levels) with a bottom that can help increase ROI.
There is another way to maximisze ROI: sell at a higher price. In the example above, buying at $10 and selling at $100 produced 900% returns while buying at $10 and selling at $120 produced 1100% returns.
The investor can check the chart to see if the price is going up or down. If it is going up, they can change their exit points and delay the sale of the stock until it reaches a resistance level (for example).
Finally, investors can use volume data as supplement to the economy-wide analysis we talked about. If the trading volume of stocks in an industry goes down significantly, it can be a sign that the market is pessimistic about the future of that industry.
Of course, market conditions can be the result of a temporary shock to the industry (falling oil prices to the energy industry, for example). But it can be a result of more fundamental problems like the Kodak and Sony example above.
Fundamental analysis for traders
Traders can also combine stock market fundamental and technical analysis.
Many traders think trading is just selecting any stock – like throwing a dart blindfolded – and watching its charts. However, there are certain qualities that a stock must have to make it appropriate for trading.
These include:
- Liquidity: If a stock is not liquid, then it will be difficult entering and exiting it. Since short-term trading depends on smooth (and fast) entry and exit, you should focus only on liquid stocks.
Liquidity is measured by trading volume – whether the daily trading volume or the average trading volume.
- Volatility: Since your goal is to make profits from short-term price movements, you should focus only on stocks that are volatile – stocks that move up and down frequently and significantly.
A stock that only goes up and down by 1% in every three months will not provide profit opportunities as one that goes up or down by 5% every day.
VolatilityVolatiltiy can be measured by the price change percentage or the average true range.
- Responsivity: If you want to trade the news then you must select stocks that are responsive to news and other events.
Though this process does not involve combing through financial statements, it is a form of fundamental analysis. This is because the aim of this process is to find stocks that are wonderful from the stock trader perspective – capable of providing multiple profit opportunities.
Also, if you are a trader that only goes long (purchases at a low price in the hope of setting at a higher price), then it makes sense to focus on undervalued wonderful companies. Why? As we have seen, stocks of these companies have potential to grow over the long term.
The only difference is that instead of waiting for it to grow from $10 to $100 over ten years, for example, you are making short-term profits as it moves from $10 to $15, $40 to $50, and $60 to $90.
In other words, companies with good fundamentals are in the best position to experience growing prices over the long term. Again, while you might not care about the long term, the short term is a component of the long term and a stock with significant long term upside can provide more opportunities to make profit.
In summary, the fundamental vs technical analysis need not be settled by putting one over the other. Rather, both can be combined even while one or the other is prioritiszed depending on whether you are a long-term investor or a stock trader.
With Sarwa, you can start your journey as a long-term investor or stock trader in the United Arab Emirates.
If you are a long-term investor, you can subscribe to Sarwa Invest to passively invest in a portfolio of low-cost ETFs designed to match your risk tolerance, investment goals, and time horizon. Or you can subscribe to Sarwa Trade to create your own investment portfolio of stocks, REITs, and ETFs.
And if you are a stock trader, you can subscribe to Sarwa Trade to buy and sell stocks and profit from short-term price movements.
Transfers from your local bank account to Sarwa Trade, and vice versa, are free. Also, your data and money are protected with bank-level SSL security.
With fractional trading, you can purchase a fraction of the share of a company. Furthermore, you can get started on the Sarwa Trade platform with just $1.
[What are you waiting for? Sign up for Sarwa Trade today to begin your stock investing and trading journey on a secure and cost-effective platform.]
Takeaways
- Fundamental analysis focuses on selecting wonderful companies with excellent performance (based on quantitative and qualitative indicators).
- Technical analysis concentrates on using historical market data to predict future price movements.
- Fundamental and technical analysis differ in their objectives, users, data sources, and results.
- Nevertheless, stock market fundamental and technical analysis can be combined with investors using technical analysis and traders using fundamental analysis.